- 3 Posts
- 145 Comments


 1·2 days ago
The problem is that it won’t stop people from using Google. Most people probably wouldn’t even notice aside from having to spend more time searching for local things, which incidentally will give Google more ad money.
The average person probably doesn’t know that search engines other than Google or Bing (or maybe Yahoo if they’re old enough) even exist. As much as it worries me that most of Firefox’s revenue comes from having Google as the default search engine, regulating that practice might actually give other search engines a chance to be seen.
 9·3 days ago
Hey did you know that any JSON file is also a valid YAML file? I bet you’ll love YAML a lot more now that you have this information
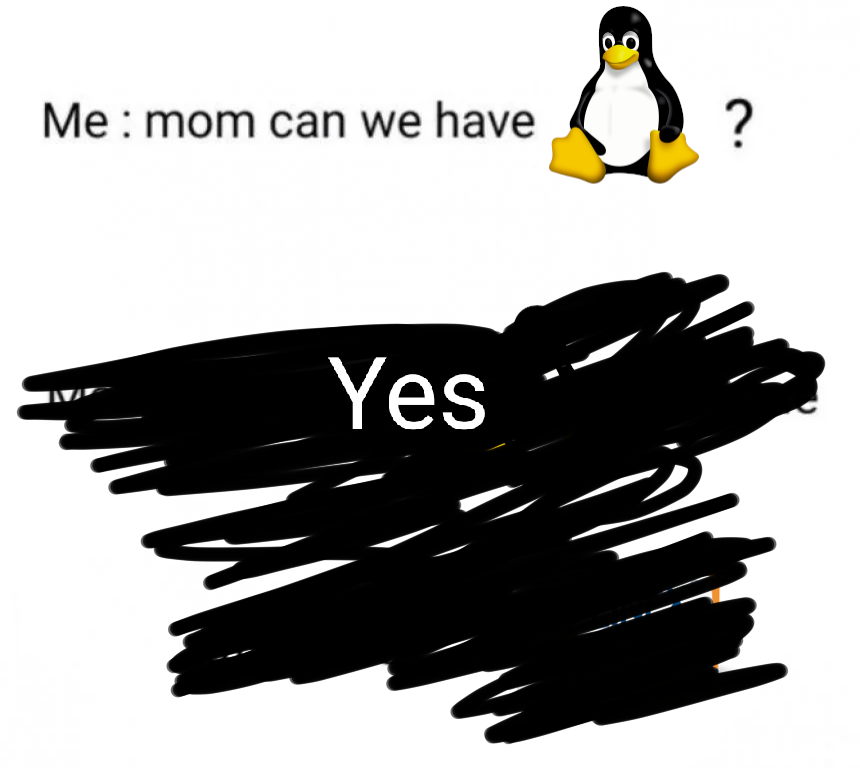
I haven’t checked back on it since I stopped using reddit (and I no longer use a surface pro) but there was a pretty active surface Linux community there as well with some good resources. For a lot of models you’ll need a USB keyboard/mouse to actually install the distro but once you can load the custom surface linux kernel things worked pretty well for me.

 6·10 days ago
here questions right the asking
Gold Silver and Crystal also! Pokemon OSTs in general are pretty good.
I was actually listening to the Gold/Silver surf theme when I clicked into this thread, it’s pretty relaxing.
It’s probably the government-subsidized corn syrup but wheat works too
 2·13 days ago
The point of the game is to shoot people with actual guns until you’re the only person (or team) left. Is the word “kill” really where ESRB draws the line?? (not that I think fortnite should be rated R)
Smh this is literally what switch statements are for

 31·17 days ago
You’re not wrong but it’s not like it’s unprecedented. North Korea already does this with Red Star OS. It’s just Linux with a bunch of spyware and government tracking/surveillance on top (edit: it’s also definitely not open source)
It won’t be open source. Who’s gonna sue Russia for license violation?
Me when Jia Tan’s business enterprises didn’t work out
Smh, it’s spelt
vimby the way
 4·1 month ago
This will be an amazing phone wallpaper
I aspire to know this level of retro trivia and am slowly falling down the rabbit hole.
There are actually relatively easy (easy compared to building a nuclear reactor) ways to deal with the waste that involve mixing it with concrete and glass so it can be safely stored in a way that won’t impact the surrounding environment. Kyle Hill has a great video about this on YouTube: https://youtu.be/4aUODXeAM-k
I completely agree with that take, I was just making a joke about how the first sentence reads like the start of a comment that’s about to defend Nintendo

It’s not even that though. The developers could have been amazing for all we know but great devs doesn’t help a paid game in a genre that already has too many games in it, most of which are free. This is especially so when the publisher does absolutely zero advertising for it past the initial announcement trailer.